
Hyperspectral Imaging Of Process Water
Thomas Arnold, Martin De Biasio, Tibor Bereczki, Krithika Sayar-Chand
Silicon Austria Labs GmbH, Villach, Austria
thomas.arnold@ausilicon-austria.com
Introduction:
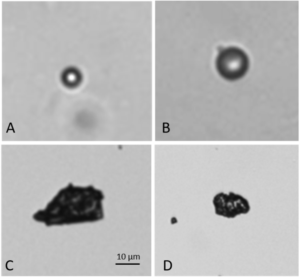
Presently, in the process applications at the heart of oil production plants suspended particles and droplets with a size larger than 1 μm are detected using plane-focused imaging systems in process pipes or, more often, bypass lines, optionally complemented by light scatter-based optical counting sensors. A quantitative analysis is done by standard image processing techniques like particle detection/tracking coupled to a counting algorithm. The overall particle load is calculated from this data assuming a given flow profile and monitored over time. A first problem here is the poor contrast, of suspended droplets, which negatively affects the reliability of the measurements and may result in underestimating the actual particle load, which in turn poses a problem for process control. In Fig. 1 example images from oil droplets and particles are shown. The images were acquired with a microscope setup with backlight illumination. Particles that are out of focus are detected by the imaging system and removed from the analysis. Computer vision algorithms are used to differentiate between solid particles and oil droplets based on their shape. Solid particles are more likely to have sharp edges, liquid droplets assume various rounded shapes. Apart from the inherently low selectivity of the approach, the reliability is limited. To increase both the contrast and the selectivity, hyperspectral imaging is used. The wavelength range is limited to transparent regions of the process solutions. Thus, the VIS/NIR region from 400 nm to 1000 nm is used. The research also includes fluorescence imaging, which is attributed a high potential to be able to both selectively and sensitively detect oil droplets within relevant time frames. An encountered challenge in current sensing schemes for particles in process water is long term stability of the optical system which is often impaired by formation of deposits on surfaces. These deposits form when particles approach these surfaces. To mitigate this problem a special designed flow cell with particle manipulation will be employed to concentrate the particles in the focal plane of the imaging system.
HSI imaging:
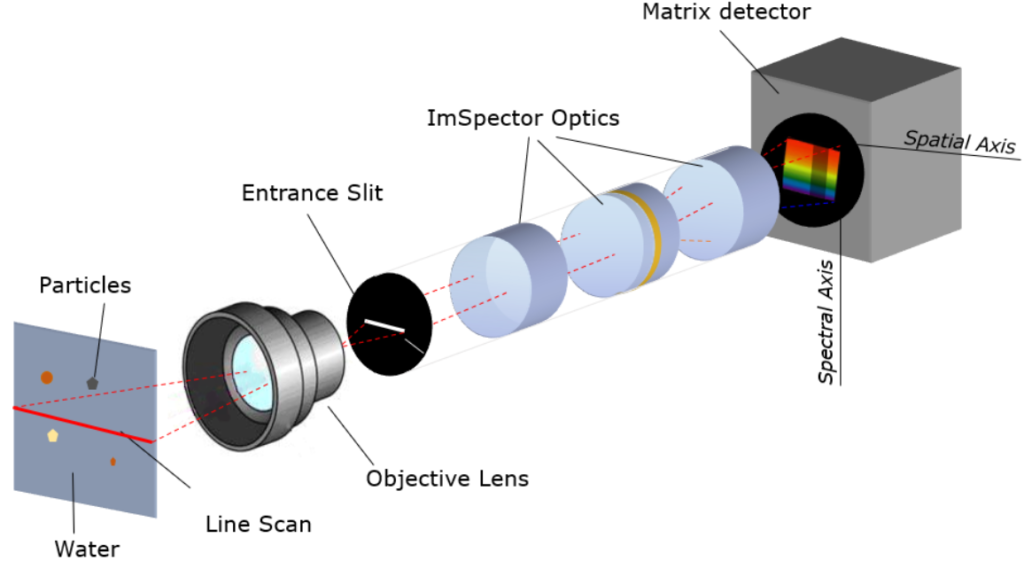
HSI is the combination of machine vision with spectroscopy and comprises the acquisition, processing, and classification of hyper-spectral images. Compared to an RGB camera that captures three broadband channels, a spectral imaging system captures up to several hundred narrow band channels. The increased spectral information makes chemometric analyses possible. The most prominent approaches to acquire hyperspectral data can be separated in spectral or spatial scanning approaches. For high throughput industrial applications spatial scanning HSI is more suitable. Instead of recording a two-dimensional image like a wavelength scanning HSI, a line across the sample, perpendicular to the direction of the relative movement, is projected into an imaging spectrograph. The spectral information for each pixel along this observation line is projected along the second axis of the two-dimensional detector chip. The spectral encoding can be provided by an imaging spectrograph (see Fig. 2). Since the spatial information along the line is retained, the images contain the spatial information along the first axis and the full spectral wavelength information along the second axis. The spectral and the first spatial dimension are simultaneously acquired, while the second spatial dimension is recorded sequentially due to the movement of the sample relative to the HSI sensor.
The HSI data acquisition process produces a three-dimensional data set with two spatial dimensions and one spectral dimension. The hyperspectral data set is also called spectral data cube or hypercube. After calibration for each image pixel a reflectance spectrum is available.
Laboratory setup:
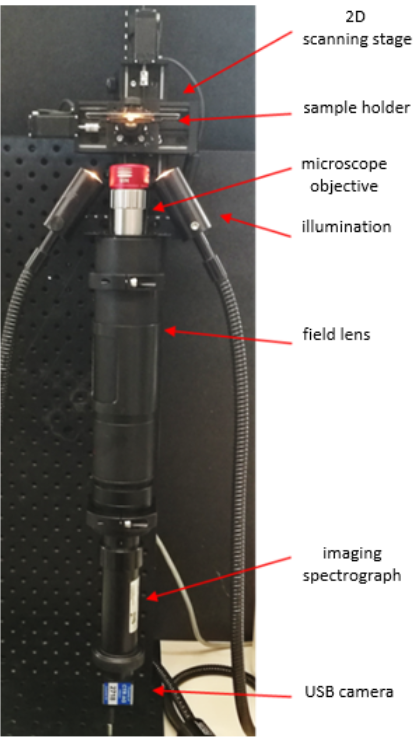
TThe hyperspectral imaging sensor consists of a NIR enhanced monochrome 10-bit camera (IDS, GER), with a pixel resolution of 2048 x 1088 pixel and a maximum frame rate of 170 Hz and an ImSpector ® V10 imaging spectrograph (Specim, FI) with a spectral range from 400 nm to 1000 nm and a 50 μm entrance slit. The system uses a long-distance 10x microscope objective and a 2x field lens to achieve a total optical magnification of 20x. The resulting spatial resolution of the hyperspectral data is 0.52μm/pixel. The measurement sample is illuminated by a 150 W fiber-coupled halogen light source (Polytec, GER). The illumination is arranged in a +45°/-45° geometry. For the movement of the sample through the scan line of the hyperspectral imaging system a motorized linear stage is used. The scan speed of the motorized linear stage is adjusted to the framerate of the imaging systems to provide square image pixel. The main components of the laboratory setup are shown in Fig. 3. The hyperspectral imaging sensors is connected by USB to the control PC. A Python control software is used to control the data acquisition and movement of the motorized linear stage. The acquired hyperspectral data is stored in the ENVI data format.
The conclusion was that at one outlet it was possible to reach almost clear phase while the other outlet was still containing the mixture. As outlets were designed in the manner to consist only one phase each (outlet 1 – heavy phase and outlet 2 – light phase), it would be the most desirable to achieve this behaviour in future design.
Measurements results:
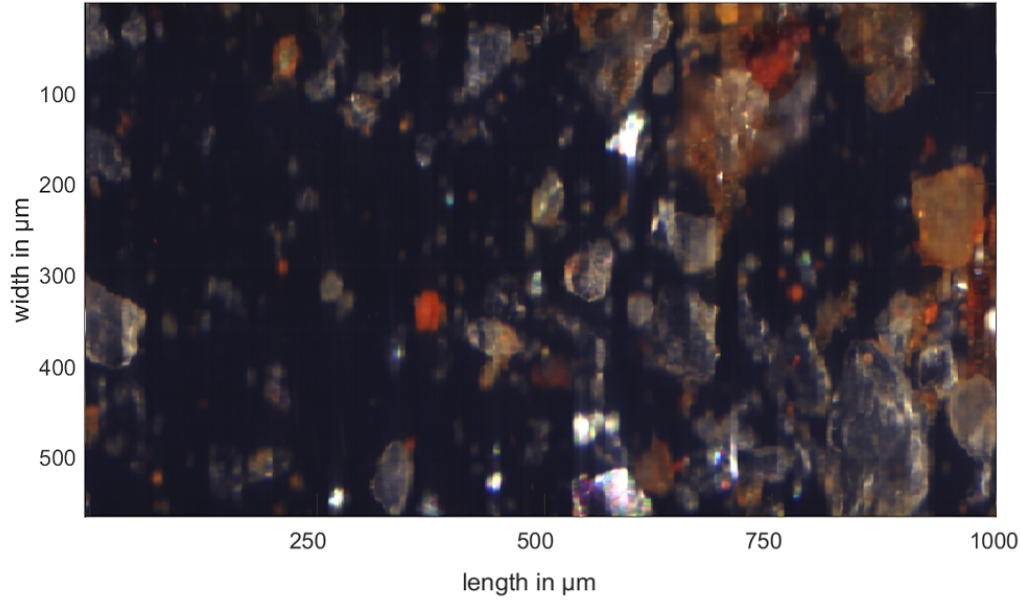
XFirst measurements were carried out on dry particle samples that were prepared in an aqueous NaCl suspension. To keep the particles in focus of the imaging system the system was inverted, and the sample liquid was placed in a sample holder. The sample holder consists of a microscope slide with a glued-on polymer ring to hold the sample liquid. Due to gravity the particles sink down to the bottom of the sample holder which is the transparent microscope slide. With the particles in one plane the translation stage is used to perform a in plane movement and scan the samples. This works well for larger particles (20μm-150μm) and has been proven to be challenging for smaller particles (1μm-20μm). Due to the powerful illumination the introduced heat creates a vortex in the sample liquid that moves the particles out of the focus of the imaging system. In Fig. 4 an RGB color image is shown that was calculated from a hyperspectral data cube that consists of 2000 hyperspectral image frames. To form the RGB channels of the image the following wavelengths regions were averaged: (R) 595 nm – 655 nm, (G) 515 nm – 575 nm, (B) 425 nm – 485 nm. The sample consist of a mixture of different particles. The high contrast between the particles and the background ensures a reliable segmentation of the particles. In this example image the big advantage of the new system is visible. Compared to the images of the existing particle analysis system that are shown in Fig. 1 the color information and the high spectral resolution can be used to determine the materials of the different particles.
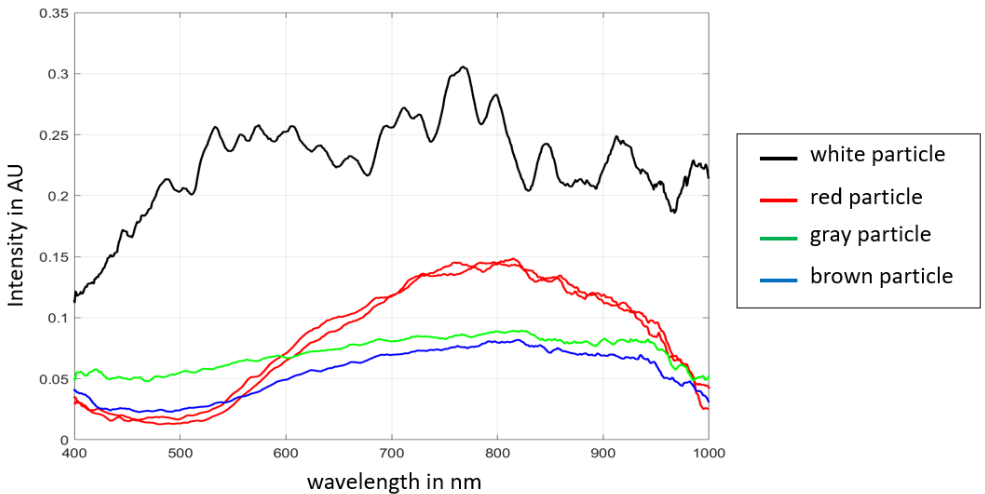
In Fig. 5 are reflectance spectra of different particles from Fig. 4 shown. The black spectrum represents the spectrum of a particle that appears in white color in the image. The red spectra are from the dark red colored particles and the blue and green spectra are from brown or gray colored particles. The spectral information makes it possible to differentiate between different particle materials.
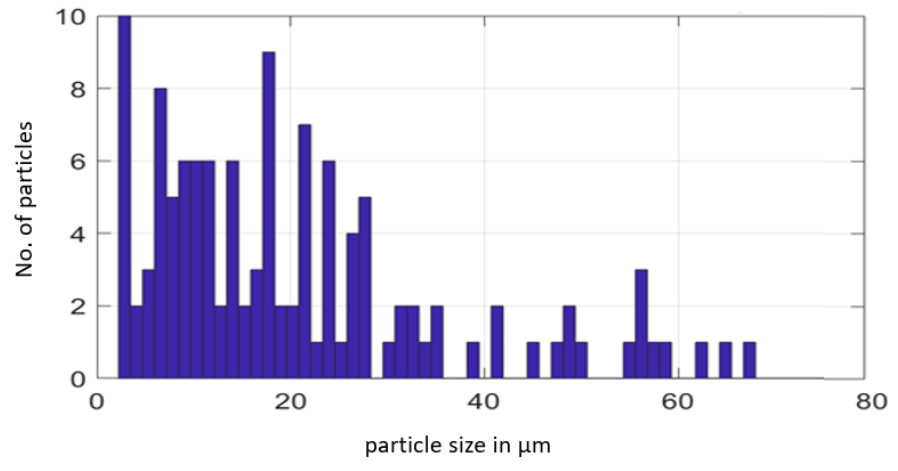
The information about the particle materials makes it possible to better control the water treatment process. By monitoring the particle size distribution in the process water, the performance of the water treatment process can be monitored. If the particle size distribution of a certain type of particle changes over time the process engineers can use this information to localize the part of the water treatment process that needs adjustment. In Fig. 6 a particle size distribution for a process water sample is shown. The particle size distribution was calculated from a hypersectral data set. In this process water sample the majority of particles was below 40μm in diameter.
Conclusion:
The presented measurement system is able to measure solid particles in process water of the petrochemical industry. It provides hyperspectral data with high spatial and spectral resolutions to improve the determination of the particle size distribution. Moreover, the spectral signatures of the particles can be used to identify the materials of the particles to give more information about the performance of the water treatment process. In future work the system will be extended by a fluorescence imaging system to reliably identify the oil droplets and complete the new particle analysis system. State of the art machine learning techniques will be applied to identify the different types of particles based on their spectral fingerprint. The completed system will be part of a sensor platform for the petrochemical industry.
Link: https://hydroptics.eu/wp-content/uploads/2021/08/HSI_v0.2.pdf