
Particle manipulation with ultrasound waves
Felix Frank, Stephan Freitag, Bernhard Lendl
Institute of Chemical Technologies and Analytics, Technische Universität Wien, Getreidemarkt 9, A-
1060 Vienna, Austria
Background:
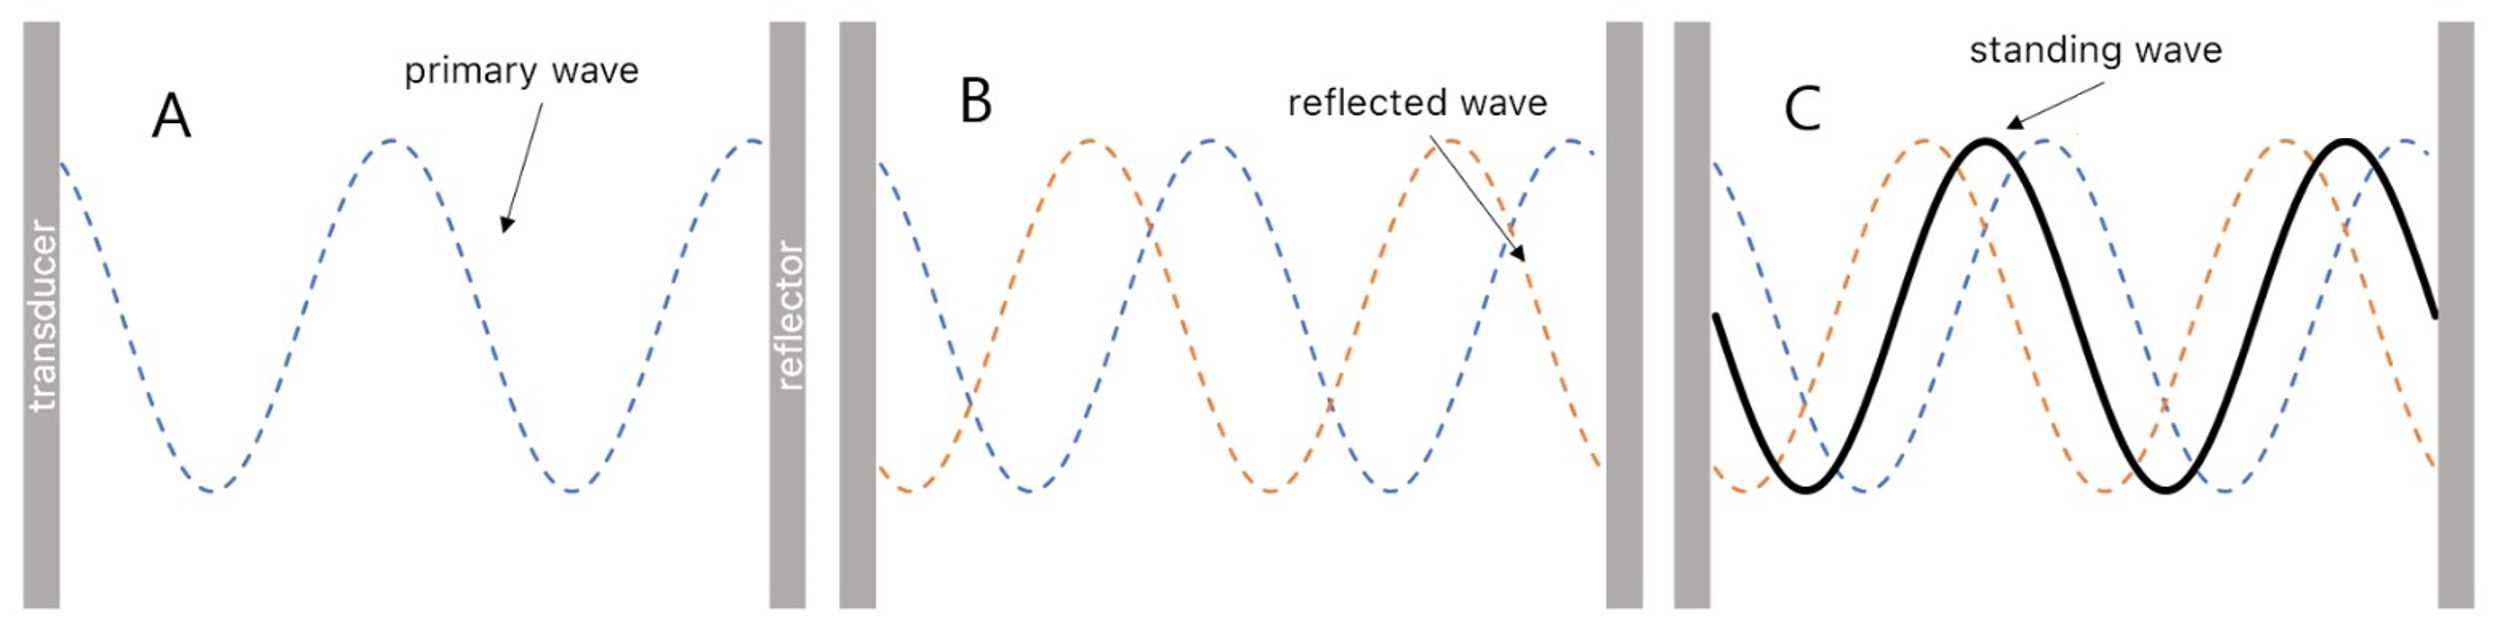
Acoustofluidic cells are used for ultrasound (US) particle manipulation in liquids. The generation of an US standing wave used for particle manipulation is shown in Figure 1. Here, a wave emitted by an US source (transducer) gets reflected when it hits the reflector. Due to interference this reflected wave superimposes with the incoming primary waves resulting in an ultrasound standing wave.
The force mainly acting on particles during US particle manipulation is called the primary radiation force Fz:
![]()
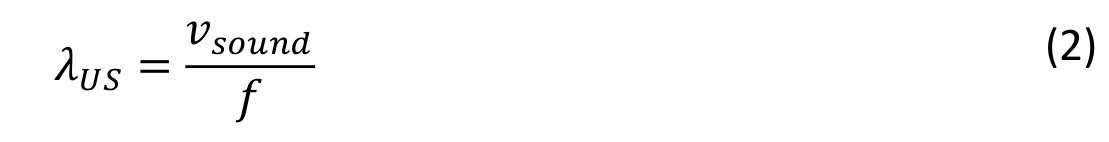
Here, Φ(κ,ρ) denotes for the acoustic contrast (which is as a function of the compressibility and the density of the particle and the medium) and Eac is the acoustic energy. The term sin(2kz) reflects the periodical character of the force and expresses the half-wavelength pattern of the nodes generated by an ultrasound standing wave. The particle radius a scales the force by the power of three and therefore has a significant influence on the primary radiation force. This has to be considered when manipulating particles of different sizes as the specified size range of the used model particles spans over one magnitude, which leads to an acoustic radiation force acting on the larger particles being three magnitudes larger than the acoustic radiation force acting on the smallest particles. The primary acoustic radiation force also directly scales with the acoustic contrast and the angular wavenumber. The acoustic contrast further defines the direction of the acoustic radiation force, focusing the particles either in the anti-nodal planes (for particles with a negative acoustic contrast such as oil droplets) or in the nodal planes (for particles with a positive acoustic contrast such as sediment particles). Regarding the frequency of the ultrasound wave, the wavelength of the US wave in water can be calculated using (2). Here, λ is the ultrasound wavelength, νsound is the speed of sound in water (1500 m/s at 293 K) and f the frequency of the ultrasound wave. Using a target frequency of 2 MHz, the wavelength is 750 μm. Hence, when using a frequency of 2 MHz, a nodal plane is formed every 375 μm
Design, Required Components (Transducers, Optical Windows, Electronics):
In recent years, the combination of ultrasound particle manipulation and various analytic methods such as ATR-FTIR spectroscopy and Raman spectroscopy has shown promising results. Based on this knowledge, an acoustofluidic cell ready for hyperspectral imaging and ultrasound particle manipulation has been designed at TUW following the approach shown in Figure 2.
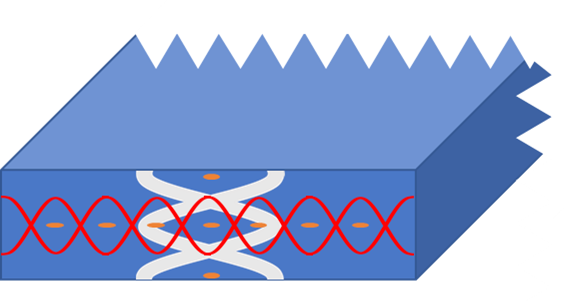
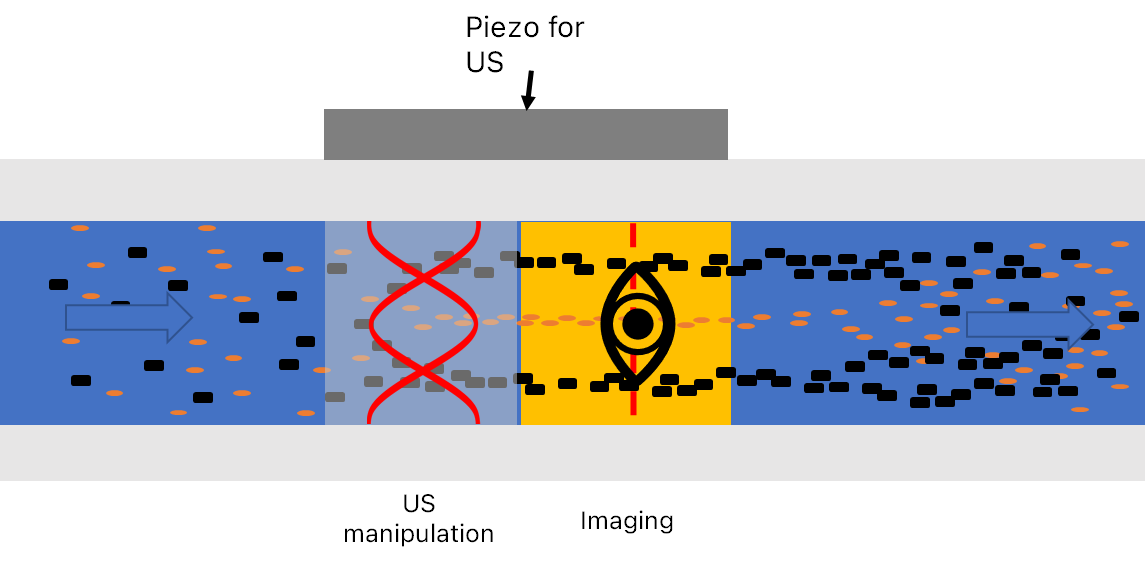
This cell has been designed to achieve both a lateral (grey) separation and an axial (red) separation, making it possible to both concentrate all particles and droplets into the focal plane of the hyperspectral imaging system and further separating oil droplets and suspended particles in this focal plane. The schematic measurement setup is shown in Figure 3 (for the prototype, the piezo is mounted under the image plane, for the sake of visibility, it is shown on the side of the cell in these figures). Here, the orange particles denote suspended solids, while the black dots denote oil droplets.
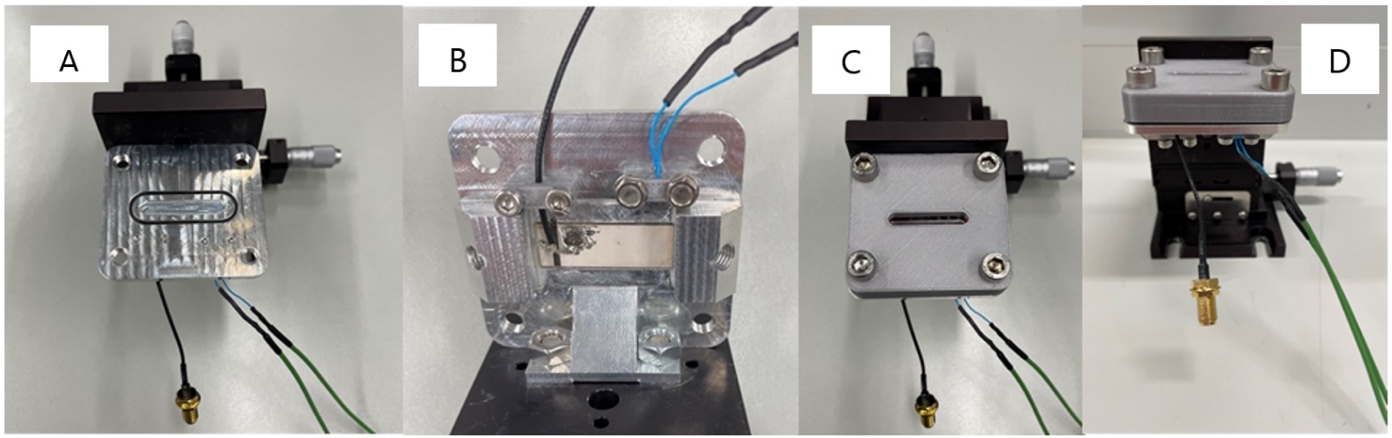
Keeping this in mind, we designed a first alpha prototype of an acoustofluidic cell with the goal of seamless integration with a hyperspectral imaging system. For these initial experiments, this cell was mounted on an xyz-stage and features temperature stabilisation to allow high US intensities. Images of the first generation acoustofluidic setup are shown in Figure 4.
Experimental setup for the demonstration of the acoustofluidic cell:
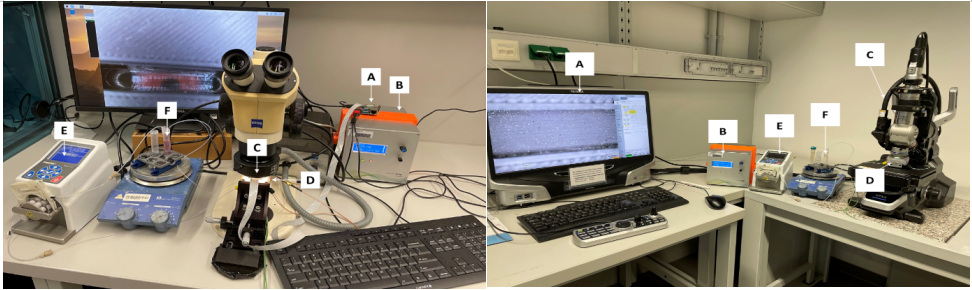
The validation of the experimental setup was performed with two setups, a simple Raspberry Pi driven routine setup and a cutting-edge Keyence Digital microscope (Osaka, Japan) for validation of theoretical performance parameters. Both systems feature a sonicamp ultrasound driver (usePAT, Vienna, Austria) and the same liquid handling setup using a peristaltic pump. The two setups are shown in Figure 5.
For the demonstration of the successful ultrasound manipulation of suspended particles, red polystyrene beads with a diameter of 10 µm were chosen as model particles. A constantly stirred particle suspension was pumped in a loop using a peristaltic pump (Ismatec SA, Opfikon, Switzerland). To enhance the contrast of the CNC machined background towards the particles, the flow cell was spray-painted with a white acrylic colour.
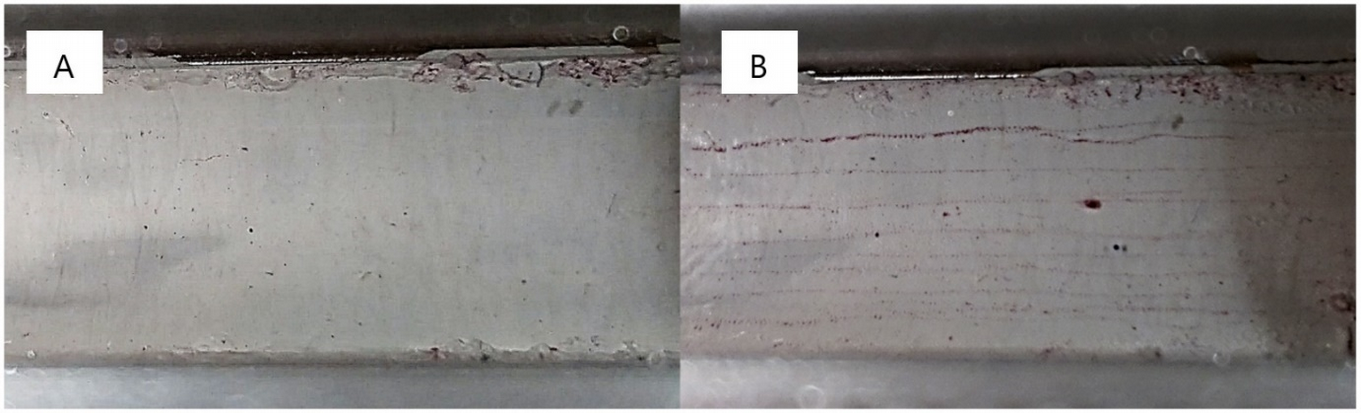
The impact of the US particle manipulation on the polystyrene beads at a steady flow can be seen in Figure 6. The particles are concentrated both laterally and axially, leading to a string like arrangement, which will be imaged by the hyperspectral imaging system in later steps.
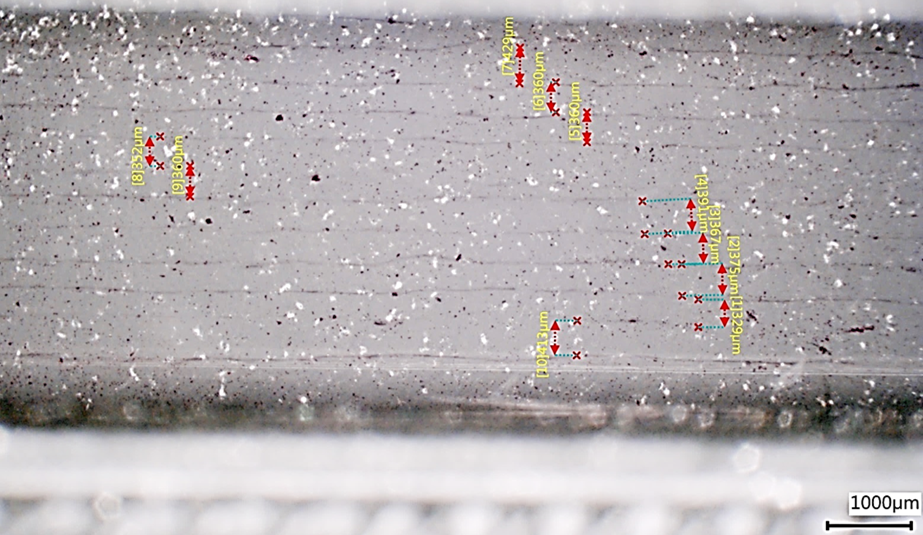
For the validation of the theoretical parameters determining the separation of the particles, the same model system was chosen, and the resulting images were processed digitally to determine the distance of 375 µm between each particle plane, confirming the theoretical parameters. The distances measured between the nodal planes are in good accordance with our theoretical considerations.
Link: pdf_version